The Strait of Hormuz Closure: Unprecedented Disruption to Global Energy Markets and Implications for Australia
- May 11
- 8 min read
Updated: 3 days ago
The Iranian conflict has triggered the effective closure of the Strait of Hormuz, removing 15% of global oil supply and disrupting LNG, fertilisers, aluminium and other critical commodities. This deep insights article reviews the scale of the shock, historical parallels from the 1970s oil crises, current market pricing, global strategic reserves, regional winners and losers, Australia’s particular vulnerabilities, and how the GERAF strategy has positioned to navigate the volatility.
The Situation
The Iranian conflict commenced on 28 February 2026 and took the world by surprise. Over the last ten weeks we have seen the Strait of Hormuz significantly interrupted. Once the US blockade went into effect on 13 April 2026, completely shut to any vessel traffic through the Strait for over four weeks.
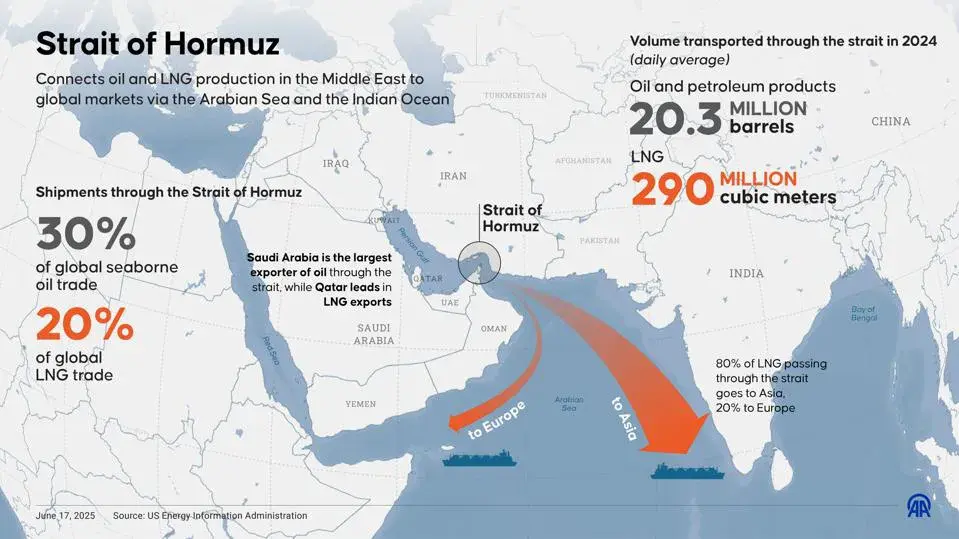
To provide some context, the Strait of Hormuz enables the transportation of significant global oil consumption. This comprises 3mmbbl/d of net exports from Iran, and the rest from other Gulf states including Saudi Arabia, UAE, Qatar, Kuwait and Iraq. Most of this trade heads to Asia. Given some crude can be diverted through Saudi and the UAE to the Red Sea through onshore pipelines, it is estimated approx. ~15mmbbl/d has been removed from world markets, representing 15% of global supply!
Breadth of the Impact
Unfortunately if that was all that was affected, that wouldn’t be such bad news, however this closing of the Strait is not only affecting oil flows, but also all other energy derived products(Liquefied Natural Gas (LNG) 20% of global trade), energy intensive products (fertilisers[1] and aluminium), alongside other products which are byproducts of these processes including sulphur[2] and helium[3]. It is hard to see how this does not have very significant flow on effects globally. If the breadth of these effects isn’t significant enough, we note that the ongoing conflict has resulted in damage to the infrastructure of Iran (e.g. South Pars gas field) and of the region (see Qatar LNG infrastructure damage below), some of which will take several years to restore. Lastly, as the blockade extends, oil or gas wells that do shut-in will see damage from being shutdown (including permanent damage) and restoring this production will take considerable capital and time (i.e. this will see meaningful delays before oil flows and LNG supplies normalise).
Qatar LNG infrastructure damage: Iran attacked the Qatar LNG complex (Ras Laffan) causing significant damage on 18 March 2026. This followed an earlier Israeli strike on the South Pars gas field. The damage caused included several LNG trains (4 and 6) owned by Qatar Energy and Exxon, affecting 17% of their export capacity and ~13mtpa, alongside Qatar Energy and Shell’s Pearl gas-to-liquids facilities. Subsequent reports have suggested it will take 3-5 years to repair the LNG facilities.
Historical Perspectives: Using the Two Supply Shocks of the 1970s as Illustrations[4] of How Oil Markets Respond to Supply Shocks and How Significant This Shock Is
The first being the Yom Kippur War Oct. ’73, when Egypt and Syria attacked Israel. Arab countries including former OPEC members imposed an oil embargo on the US and other supporters of Israel. They also cut production (largely from Iran and Kuwait, note Syria and Egypt produced little oil at the time). The production cuts reduced OPEC supplies from 29.1mmbbl/d ’73 to 25.7 by ’75 [5], a reduction of (3.4)mmbbl/d or (6)% of global oil demand at the time (56mmbbl/d). Severe shortages followed in the US and Europe, with long lines at the pumps and odd-even rationing. At the time global demand was growing rapidly. Average global demand growth 1970-79 was close to 4% pa, or +2mmbbl/d, with US, Europe, Japan and China all growing rapidly. This saw oil prices spike with average monthly WTI lifting from $3.50/bbl to over $14/bbl from 1972- ‘77, respectively, a quadrupling in the oil price over the period.
The Iranian revolution in 1978/79[6] was the last significant sustained supply disruption. Iran reduced its oil production from 5.3 to 1.4mmbbl/d over the subsequent two years, when global oil demand was still strong. At the time global oil demand was 63mmbbl/d and this reduction represented 6% of global demand. Furthermore, the US imported ~40% of oil consumption and was heavily reliant on global supplies. This resulted in meaningful increases in oil prices moving upwards from US$15/bbl (1978) to US$37/bbl (1980)[7] or by ~150% over the subsequent two years.
The two oil crisis of the 1970’s led to major reform in the OECD, where countries realised that oil could be weaponised. This led to pro-active steps to mitigate this reliance including the creation of Strategic Petroleum Reserves and seeking more diversified energy sources. France for example initiated a program to reduce their reliance on oil through building nuclear reactors which over the subsequent 20 years led to nuclear energy generating the majority of their grid power.
Recent Oil Price Impacts
CME[8] WTI spot oil price futures trade at >US$100/bbl and December 2027 futures at >$70/bbl. Prior to Iranian conflict spot prices were closer to $60/bbl and longer-term futures prices closer to $55/bbl, thus they have shifted upwards materially. The futures curve suggests the oil price effects will be elevated for 18 months. Furthermore, there is a lot of commentary suggesting that financial markets are disconnected from physical markets, and on one of the quarterly calls for an investment in GERAF, the CFO explained physical oil was trading at $30/bbl premium to those in financial markets. I heard an industry expert last week suggest that every week of delays in restoring oil production should add $12/bbl to the Brent oil price by year end. With higher oil prices, we will see higher gas prices.
Global Strategic Petroleum Reserves (SPR)
The US SPR was created in 1975, under President Ford’s administration, and was a reaction to the 1973 oil crisis. It has up to 1bnbbl of capacity and is currently holding 700mbbl. China commenced construction of its SPR in early 2000s and is estimated to be between 1.0-1.4bnbbl. Japan ~470mmbbl, OECD 180mmbbl and other countries combined ensure that Global SPR’s are estimated to be close to 2.5bn bbls. The aim of these SPR’s is typically to ensure ~100 days of net import coverage is achieved for each respective country. As context, currently these SPR’s provide this coverage for the respective countries and 25 days’ worth of global aggregate demand consumption. In comparison Australia does not have an SPR but instead imposed Minimum Stockholding Obligations on oil companies and importers, which equates to <30 days of coverage.
Winners and Losers
Since Asia is short crude and gas supply, it is expected the broader Asian region will feel the effects of this blockade most severely. Countries with sensible long-term energy security plans and diversified energy sources (China and Japan) will be buttressed from the effects of oil and LNG disruptions for a period of time given the energy storage they have in place. We expect the less thoughtful (Australia) or prosperous countries will suffer significantly, as will Europe given its heavy reliance on oil & gas imports. Emerging markets with oil & gas are expected to be beneficiaries. As explained previously, the US on the other hand has moved from an oil and gas net importer to a net exporter over the last two decades[9], thus we expect they will be affected the least and may in fact benefit economically. Like Russia in the Ukraine invasion, they may well profit short-term from this re-pricing across the broader energy complex and the heightened demand for their exports. That said there will undoubtedly be flow-on effects to the US, in particular inflationary effects given the global connectivity of the energy markets, but they will still be protected by their broader exposure to these fuel sources and their sizeable SPR.
Australia
Australia has been a net importer of crude since 2000, with its proportion of imports (as a % of demand) lifting from 3% in 2000 to 67% in 2024. This steady rise reached 60% in 2013, over a decade ago, and has been broadly constant since. Over that period our oil demand has continued to grow by 1.2% pa, whilst supplies have declined. We currently import meaningful volumes. If we sought to be compliant with IEA directives of coverage of 90 days of net imports, this would require a meaningful investment in storage. Our Prime Minister and Penny Wong appear to be trying to secure supplies across Asia, using trade as leverage to do so. This is an interesting approach given Asia has large scale refineries (enabling the production of petroleum, diesel and jet fuel), but they have no material indigenous crude supply and are thus acutely affected by the Strait of Hormuz disruptions as well! An obvious short-term solution for our country would be for the Federal Government to go to the US and strike a deal with the Trump administration, as that country has both crude and refined products, is exporting, and is an ally. However, they seem reluctant to do so. Until now, they instead they are pursuing a strategy akin to asking Coles to guarantee supply of food, when the farms are closed. This approach by the Federal Government engaging with Asian trade partners looks unlikely to succeed and the signs appear ominous for our economy in the weeks ahead. Furthermore, albeit longer dated, you would think the Federal response would involve the support of building out our refined product storage capabilities, supporting refineries and potentially deepening this industry and stimulating oil and gas exploration and development. The only sign any of these are being pursued came last night in the budget, where $15bn was allocated to ‘fuel security’[10]., where the Government appears to be relaxing minimum stockholdings obligations, underwriting additional cargoes of fuel and fertilisers, adjusting fuel standards and supporting domestic refineries. Jet fuel and diesel holdings will be lifted to 50 days of reserves. These are all positive steps, and if they are executed, will help medium term.
We have seen continued actions that seek to chase capital away from Australia. The recent proposals to retrospectively implement foreign resident capital gains tax (CGT) changes[11], Government proposals to further tax gas exports and now east coast domestic gas reservation policies all continue to undermine investor confidence. Attracting investment into Australia certainly does not appear to be on this Government’s agenda. One does wonder who will continue to finance this country’s capital needs, if our Federal Government keeps behaving in this way.
Implications for GERAF Strategy
Fortunately the GERAF strategy involves exposure to the oil & gas complex, with a specific focus on gas. The portfolio has significantly benefited from this exposure as this sector has moved from delivering to the end of February minor absolute returns (i.e. a drag on absolute returns) but alpha above the underlying commodity price, to meaningful contributions on both accounts now. This also helped mitigate a broader market correction being experienced across other parts of the GERAF portfolio.
[1] Ammonia and urea where the region supply 20-35% seaborne share
[2] Used to produce sulphuric acid critical for copper production and fertilisers, Gulf historically had 50% global seaborne share
[3] Qatar is the second largest producer after the US, accounting for 33% of global production, used in semi-conductor manufacturing, medical imaging
[4] All demand and supply data sourced from 2025 Statistical Review of World Energy data
[5] According to the 2025 Statistical Review of World Energy
[6] The fall of Shah Mohammad Reza Pahlavi occurred on 11 February 1979, and the Islamic Republic of Iran was established 1 April 1979. Unrest commenced in 1977 and in earnest in January 1978.
[7] Average monthly WTI oil prices
[8] Chicago Mercantile Exchange
[9] US remains the second largest importer of crude globally


Comments